
Average Life Expectancy: Female

Please put your mouse on the map above
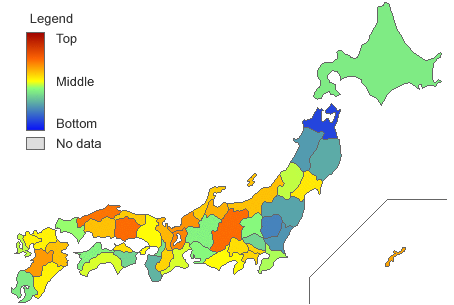
Average female life expectancy by prefecture from the Minsitry of Health, Labour and Welfare's life tables by prefecture. This data is prepared every 5 years and the most recent data is for 2005.
Life Table by Prefecture:
"The life table by prefecture is constructed every five years based on the Annual Vital Statistics and the Population Census, from 1965. This year marks the 9th time. The life table by prefecture is inevitable for comparative analysis of the situation of death on a prefectural level."
The transition of the average female life expectancy for the 40 year period from 1965 when this research was commenced is as follows:
In the period of 40 years, the average female life expectancy grew by 12.86 years, or by 118%. This rate of increase is slightly greater than the average male life expectancy.
The average female life expectancy is longest in Okinawa with 86.88 years. This is 2.08 years longer than the average female life expectancy in Aomori. 2.08 years is smaller than the difference between the longest and shortest average male life expectancy which is 3.57 years, and thus it can be said that there is less regional difference compared to the average male life expectancy.
Regionally, life expectancy is generally long in areas in western Japan including Okinawa. Nagano, a prefecture in eastern Japan which is ranked high, has the longest average male life expectancy.
Few causal connections can be seen from the correlative ranking. Although these rankings have no causal connection, it is interesting to note that female life expectancy is long in areas with high ratio of votes for the People's New Party and short in areas with high ratio of votes for Your Party.
AVERAGE LIFE EXPECTANCY: FEMALE
| Rank | Prefectures | Average Life Expectancy: Female | Standard Score |
|---|---|---|---|
| Sort | Desc Asc | Desc Asc | Desc Asc |
| 1 | Nagano | 87.68歳 | 66.44 |
| 2 | Okayama | 87.67歳 | 66.19 |
| 3 | Shimane | 87.64歳 | 65.44 |
| 4 | Shiga | 87.57歳 | 63.69 |
| 5 | Fukui | 87.54歳 | 62.94 |
| 6 | Kumamoto | 87.49歳 | 61.69 |
| 7 | Okinawa | 87.44歳 | 60.44 |
| 8 | Toyama | 87.42歳 | 59.94 |
| 9 | Kyoto | 87.35歳 | 58.19 |
| 10 | Hiroshima | 87.33歳 | 57.69 |
| 11 | Niigata | 87.32歳 | 57.44 |
| 12 | Oita | 87.31歳 | 57.19 |
| 13 | Ishikawa | 87.28歳 | 56.44 |
| 14 | Tottori | 87.27歳 | 56.19 |
| 15 | Tokyo | 87.26歳 | 55.94 |
| 16 | Nara | 87.25歳 | 55.69 |
| 17 | Kanagawa | 87.24歳 | 55.44 |
| 18 | Yamanashi | 87.22歳 | 54.94 |
| 19 | Kagawa | 87.21歳 | 54.69 |
| 20 | Miyagi | 87.16歳 | 53.44 |
| 21 | Fukuoka | 87.14歳 | 52.94 |
| 22 | Saga | 87.12歳 | 52.44 |
| 22 | Miyazaki | 87.12歳 | 52.44 |
| 24 | Shizuoka | 87.10歳 | 51.94 |
| 25 | Hyogo | 87.07歳 | 51.19 |
| 26 | Kochi | 87.01歳 | 49.69 |
| 27 | Mie | 86.99歳 | 49.19 |
| 28 | Nagasaki | 86.97歳 | 48.69 |
| 29 | Yamagata | 86.96歳 | 48.44 |
| 30 | Chiba | 86.91歳 | 47.19 |
| 31 | Yamaguchi | 86.88歳 | 46.44 |
| 32 | Aichi | 86.86歳 | 45.94 |
| 33 | Gunma | 86.84歳 | 45.44 |
| 34 | Gifu | 86.82歳 | 44.94 |
| 34 | Ehime | 86.82歳 | 44.94 |
| 36 | Kagoshima | 86.78歳 | 43.94 |
| 37 | Hokkaido | 86.77歳 | 43.69 |
| 38 | Osaka | 86.73歳 | 42.69 |
| 39 | Saitama | 86.66歳 | 40.94 |
| 39 | Tokushima | 86.66歳 | 40.94 |
| 41 | Wakayama | 86.47歳 | 36.20 |
| 42 | Iwate | 86.44歳 | 35.45 |
| 43 | Fukushima | 86.40歳 | 34.45 |
| 44 | Akita | 86.38歳 | 33.95 |
| 45 | Ibaraki | 86.33歳 | 32.70 |
| 46 | Tochigi | 86.24歳 | 30.45 |
| 47 | Aomori | 85.93歳 | 22.70 |
| Japan | 87.01歳 |
関連記事
POSITIVE CORRELATION STATS (DIRECTLY PROPORTIONAL)
NEGATIVE CORRELATION STATS (INVERSE PROPORTIONAL)
CATEGORY : HEALTH
- Average Life Expectancy: Female
- Average Life Expectancy: Male
- Number of Physicians
- Practicing Physicians
- Female Physicians
- Male Physicians
- Dentists
- AIDS Patients
- Japanese and Foreign HIV Carriers
- Obstetricians and Gynecologists
- Rate of Obstetricians and Gynecologists
- Pediatricians
- Rate of Pediatricians
- Death due to Bowel Cancer: Male
- Death due to Bowel Cancer: Female
- Death due to Liver Cancer: Male
- Death due to Liver Cancer: Female
- Death due to Stomach Cancer: Male
- Death due to Stomach Cancer: Female
- Death due to Lung Cancer: Male
- Death due to Lung Cancer: Female
- Death due to Old Age: Male
- Death due to Old Age: Female
- Death Due to Cancer : Male
- Death Due to Cancer : Female
- Japanese HIV Carriers
- Rate of Smoking: Female
- Rate of Smoking: Male
- H1N1 Influenza
SPONSORED LINKS
RECENT UPDATES
TOP STATS
- 1 Mean Elevation

- 2 Fitness Clubs

- 3 Convenience Stores

- 4 Total Floor Space of Residential Buildings of one's own

- 5 Mean Age at First Marriage (Male)
")
- 6 Christians

- 7 Automobiles Registered

- 8 Prefectural Income

- 9 Homeownership

- 10 Thai Residents in Japan

- 11 Foreign Residents in Japan

- 12 Philippine Residents in Japan

- 13 Rate of Forest Land

- 14 Population Density

- 15 Vietnamese Residents in Japan
