
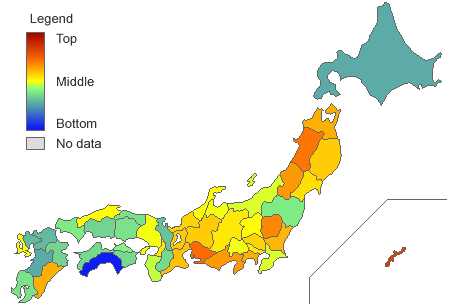
Rate of Obstetricians and Gynecologists

Please put your mouse on the map above
The rate of obstetricians and gynecologists among practicing physicians. A clear regional trend, a high-east low-west distribution, can be seen in this ranking, which is the complete opposite of the number of physicians.
Because the numbers of obstetricians and gynecologists per unit population were similar in both western Japan and eastern Japan, the rates of obstetricians and gynecologists decreases in western Japan where the numbers of physicians is greater.
Because this similar trend can be seen in the rate of pediatricians as well, it can be said that the numbers of pediatricians, obstetricians and gynecologists do not differ greatly on a national level, but there are many physicians in other departments in western Japan.
RATE OF OBSTETRICIANS AND GYNECOLOGISTS
| Rank | Prefectures | Rate of Obstetricians and Gynecologists | Standard Score |
|---|---|---|---|
| Sort | Desc Asc | Desc Asc | Desc Asc |
| 1 | Okinawa | 4.90% | 73.21 |
| 2 | Aichi | 4.59% | 66.25 |
| 3 | Akita | 4.55% | 65.36 |
| 4 | Tochigi | 4.46% | 63.34 |
| 5 | Shizuoka | 4.38% | 61.54 |
| 6 | Yamagata | 4.36% | 61.10 |
| 7 | Aomori | 4.27% | 59.08 |
| 7 | Kanagawa | 4.27% | 59.08 |
| 7 | Miyazaki | 4.27% | 59.08 |
| 10 | Ibaraki | 4.26% | 58.85 |
| 11 | Mie | 4.18% | 57.06 |
| 12 | Shiga | 4.17% | 56.83 |
| 13 | Gifu | 4.15% | 56.39 |
| 14 | Iwate | 4.14% | 56.16 |
| 15 | Saitama | 4.11% | 55.49 |
| 15 | Fukui | 4.11% | 55.49 |
| 17 | Miyagi | 4.08% | 54.82 |
| 18 | Tokyo | 4.02% | 53.47 |
| 19 | Osaka | 4.01% | 53.25 |
| 20 | Nagano | 4.00% | 53.02 |
| 21 | Shimane | 3.95% | 51.90 |
| 22 | Ishikawa | 3.93% | 51.45 |
| 23 | Gunma | 3.91% | 51.00 |
| 23 | Nagasaki | 3.91% | 51.00 |
| 25 | Toyama | 3.90% | 50.78 |
| 25 | Yamanashi | 3.90% | 50.78 |
| 27 | Hyogo | 3.89% | 50.55 |
| 28 | Niigata | 3.84% | 49.43 |
| 29 | Chiba | 3.83% | 49.21 |
| 30 | Wakayama | 3.79% | 48.31 |
| 31 | Kagawa | 3.61% | 44.27 |
| 32 | Yamaguchi | 3.57% | 43.38 |
| 33 | Fukushima | 3.56% | 43.15 |
| 34 | Tottori | 3.55% | 42.93 |
| 35 | Okayama | 3.52% | 42.25 |
| 36 | Kagoshima | 3.51% | 42.03 |
| 37 | Tokushima | 3.50% | 41.81 |
| 38 | Ehime | 3.49% | 41.58 |
| 39 | Nara | 3.48% | 41.36 |
| 40 | Hiroshima | 3.46% | 40.91 |
| 41 | Oita | 3.44% | 40.46 |
| 42 | Kyoto | 3.36% | 38.67 |
| 43 | Fukuoka | 3.33% | 37.99 |
| 43 | Saga | 3.33% | 37.99 |
| 45 | Kumamoto | 3.22% | 35.53 |
| 46 | Hokkaido | 3.20% | 35.08 |
| 47 | Kochi | 2.41% | 17.36 |
| Japan | 3.90% |
POSITIVE CORRELATION STATS (DIRECTLY PROPORTIONAL)
NEGATIVE CORRELATION STATS (INVERSE PROPORTIONAL)
CATEGORY : HEALTH
- Average Life Expectancy: Female
- Average Life Expectancy: Male
- Number of Physicians
- Practicing Physicians
- Female Physicians
- Male Physicians
- Dentists
- AIDS Patients
- Japanese and Foreign HIV Carriers
- Obstetricians and Gynecologists
- Rate of Obstetricians and Gynecologists
- Pediatricians
- Rate of Pediatricians
- Death due to Bowel Cancer: Male
- Death due to Bowel Cancer: Female
- Death due to Liver Cancer: Male
- Death due to Liver Cancer: Female
- Death due to Stomach Cancer: Male
- Death due to Stomach Cancer: Female
- Death due to Lung Cancer: Male
- Death due to Lung Cancer: Female
- Death due to Old Age: Male
- Death due to Old Age: Female
- Death Due to Cancer : Male
- Death Due to Cancer : Female
- Japanese HIV Carriers
- Rate of Smoking: Female
- Rate of Smoking: Male
- H1N1 Influenza
SPONSORED LINKS
RECENT UPDATES
TOP STATS
- 1 Rate of Forest Land

- 2 Homeownership

- 3 Mean Elevation

- 4 Automobiles Registered

- 5 Convenience Stores

- 6 Total Floor Space of Residential Buildings of one's own

- 7 Area

- 8 Population Density

- 9 Foreign Residents in Japan

- 10 Length of Coastline

- 11 Average Residential Land Price

- 12 Prefectural Income

- 13 Railway Passenger Transport

- 14 Rate of Smoking: Male

- 15 Russian Residents in Japan
