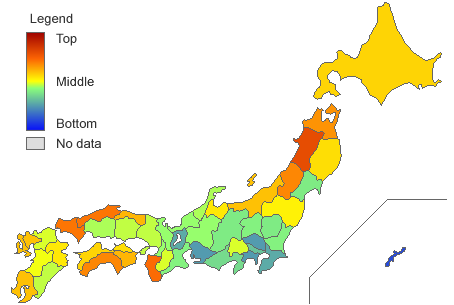
Death Due to Cancer : Male

Please put your mouse on the map above
The Ministry of Health, Labour and Welfare's vital statistics include data on the cause of death by prefecture. Although this is rather negative information, many causes of death have to do with lifestyle in various areas.
Of the three major causes of death, cancer, cardiac disorder and cerebrovascular disease, men's cancer has been picked up here. The distribution map shows that there are many deaths due to cancer in "both ends" of Japan, such as Kyushu, Shikoku, the Tohoku area and Hokkaido. On the other hand, there are fewer deaths due to cancer in areas from around Tokyo to Kansai.
Because there are many types of cancer and there are lifestyle habits (such as smoking, high-salt diets, etc) associated with each type, data on the individual types of cancer will also be examined.
DEATH DUE TO CANCER : MALE
Source Vital Statistics (2006)
| Rank | Prefectures | Death Due to Cancer : Male | Standard Score | |
|---|---|---|---|---|
| Amount | per 100000 Man | |||
| Sort | Desc Asc | Desc Asc | Desc Asc | Desc Asc |
| 1 | Akita | 2,332人 | 431.42 | 71.84 |
| 2 | Wakayama | 1,999人 | 409.61 | 66.71 |
| 3 | Shimane | 1,437人 | 406.27 | 65.93 |
| 4 | Yamaguchi | 2,840人 | 403.57 | 65.29 |
| 5 | Yamagata | 2,324人 | 397.25 | 63.81 |
| 6 | Kochi | 1,475人 | 393.93 | 63.03 |
| 7 | Aomori | 2,668人 | 392.89 | 62.78 |
| 8 | Tokushima | 1,441人 | 374.64 | 58.49 |
| 9 | Tottori | 1,084人 | 373.55 | 58.24 |
| 10 | Kagoshima | 3,050人 | 372.11 | 57.90 |
| 11 | Nagasaki | 2,569人 | 371.54 | 57.76 |
| 12 | Niigata | 4,339人 | 368.67 | 57.09 |
| 13 | Saga | 1,504人 | 368.42 | 57.03 |
| 14 | Ehime | 2,506人 | 362.31 | 55.59 |
| 15 | Hokkaido | 9,650人 | 360.74 | 55.23 |
| 16 | Iwate | 2,372人 | 357.46 | 54.45 |
| 17 | Kagawa | 1,730人 | 355.89 | 54.09 |
| 18 | Toyama | 1,891人 | 353.05 | 53.42 |
| 19 | Oita | 2,010人 | 352.76 | 53.35 |
| 20 | Fukushima | 3,558人 | 349.95 | 52.69 |
| 21 | Kumamoto | 2,969人 | 342.48 | 50.93 |
| 22 | Fukuoka | 8,088人 | 337.83 | 49.84 |
| 23 | Yamanashi | 1,456人 | 335.82 | 49.37 |
| 24 | Nara | 2,270人 | 335.61 | 49.32 |
| 25 | Hyogo | 8,939人 | 333.51 | 48.83 |
| 26 | Miyazaki | 1,795人 | 331.11 | 48.26 |
| 27 | Okayama | 3,107人 | 331.03 | 48.24 |
| 28 | Hiroshima | 4,580人 | 329.45 | 47.87 |
| 29 | Ishikawa | 1,852人 | 326.60 | 47.20 |
| 30 | Osaka | 13,935人 | 325.54 | 46.95 |
| 31 | Kyoto | 4,131人 | 324.51 | 46.71 |
| 32 | Gifu | 3,293人 | 322.66 | 46.28 |
| 33 | Fukui | 1,280人 | 322.20 | 46.17 |
| 34 | Mie | 2,860人 | 315.25 | 44.53 |
| 35 | Gunma | 3,137人 | 314.85 | 44.44 |
| 36 | Ibaraki | 4,655人 | 314.54 | 44.37 |
| 37 | Nagano | 3,334人 | 312.11 | 43.80 |
| 38 | Miyagi | 3,585人 | 311.96 | 43.76 |
| 39 | Tochigi | 3,125人 | 311.84 | 43.73 |
| 40 | Shizuoka | 5,683人 | 304.16 | 41.93 |
| 41 | Tokyo | 18,065人 | 288.35 | 38.21 |
| 42 | Shiga | 1,897人 | 278.37 | 35.86 |
| 43 | Chiba | 8,430人 | 278.27 | 35.84 |
| 44 | Saitama | 9,520人 | 267.80 | 33.38 |
| 45 | Aichi | 9,697人 | 266.48 | 33.07 |
| 46 | Kanagawa | 11,838人 | 266.35 | 33.04 |
| 47 | Okinawa | 1,505人 | 225.13 | 23.35 |
| Japan | 197,805人 | 317.26 | ||
POSITIVE CORRELATION STATS (DIRECTLY PROPORTIONAL)
NEGATIVE CORRELATION STATS (INVERSE PROPORTIONAL)
CATEGORY : HEALTH
- Average Life Expectancy: Female
- Average Life Expectancy: Male
- Number of Physicians
- Practicing Physicians
- Female Physicians
- Male Physicians
- Dentists
- AIDS Patients
- Japanese and Foreign HIV Carriers
- Obstetricians and Gynecologists
- Rate of Obstetricians and Gynecologists
- Pediatricians
- Rate of Pediatricians
- Death due to Bowel Cancer: Male
- Death due to Bowel Cancer: Female
- Death due to Liver Cancer: Male
- Death due to Liver Cancer: Female
- Death due to Stomach Cancer: Male
- Death due to Stomach Cancer: Female
- Death due to Lung Cancer: Male
- Death due to Lung Cancer: Female
- Death due to Old Age: Male
- Death due to Old Age: Female
- Death Due to Cancer : Male
- Death Due to Cancer : Female
- Japanese HIV Carriers
- Rate of Smoking: Female
- Rate of Smoking: Male
- H1N1 Influenza

