
Homeownership

Please put your mouse on the map above
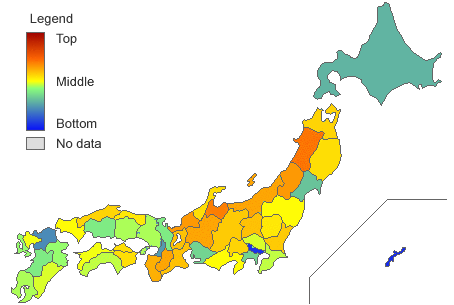
Rate of homeownership from the House and Land Statistics Survey. The House and Land Statistics Survey is conducted every 5 years and it picks out from the survey area, houses and households living in such houses. According to the statistics, there are 49,600,000 houses of which 30,310,000, that is 61.12%, are owned.
The rate of homeownership is highest in Akita, with 78.39%. Prefectures where there are many agricultural communities Toyama, Fukui, Yamagata and Niigata are ranked high. On the other hand, the lowest ranked is Tokyo with 44.63%. Other urban areas such as Fukuoka, Kanagawa, Osaka and Kyoto are also ranked low. The data shows that the rate of homeownership is high in rural areas and low in urban areas.
Hokkaido and Okinawa slightly stray from this trend. The rate of homeownership is around 50% and is low in both prefectures. There seems to be enough land in both prefectures, so it might be a matter of some difference in lifestyle.
The correlative ranking shows that it is positively correlated with the number of Automobiles Registered and the number of people engaged in agriculture. Here again, it can be seen that the rate of homeownership is high in rural areas.
On the other hand, it should be noted that it is negatively correlated with the rate of people living alone and the rate of nuclear families. This means that in areas where the rate of homeownership is low, the rate of nuclear families as well as the rate of people living alone are high.
HOMEOWNERSHIP
| Rank | Prefectures | Homeownership | Standard Score |
|---|---|---|---|
| Sort | Desc Asc | Desc Asc | Desc Asc |
| 1 | Akita | 77.38% | 65.32 |
| 2 | Toyama | 76.68% | 64.35 |
| 3 | Yamagata | 74.92% | 61.90 |
| 4 | Fukui | 74.85% | 61.80 |
| 5 | Gifu | 74.23% | 60.94 |
| 6 | Nara | 74.14% | 60.82 |
| 7 | Niigata | 74.04% | 60.68 |
| 8 | Wakayama | 73.11% | 59.39 |
| 9 | Mie | 72.11% | 58.00 |
| 10 | Shiga | 71.64% | 57.34 |
| 11 | Gunma | 71.42% | 57.04 |
| 12 | Nagano | 71.33% | 56.91 |
| 13 | Ibaraki | 71.14% | 56.65 |
| 14 | Aomori | 70.41% | 55.63 |
| 15 | Yamanashi | 70.16% | 55.29 |
| 16 | Shimane | 70.13% | 55.24 |
| 17 | Iwate | 69.95% | 54.99 |
| 18 | Ishikawa | 69.42% | 54.26 |
| 19 | Kagawa | 69.31% | 54.10 |
| 20 | Tokushima | 69.26% | 54.03 |
| 21 | Tochigi | 69.11% | 53.83 |
| 22 | Tottori | 68.96% | 53.62 |
| 23 | Fukushima | 67.70% | 51.87 |
| 24 | Yamaguchi | 67.18% | 51.14 |
| 25 | Shizuoka | 67.11% | 51.05 |
| 26 | Saga | 66.79% | 50.60 |
| 27 | Ehime | 66.53% | 50.24 |
| 28 | Saitama | 65.88% | 49.34 |
| 29 | Miyazaki | 65.78% | 49.20 |
| 30 | Chiba | 65.52% | 48.84 |
| 31 | Kochi | 65.07% | 48.21 |
| 32 | Hyogo | 64.90% | 47.97 |
| 33 | Okayama | 64.88% | 47.95 |
| 34 | Kagoshima | 64.63% | 47.60 |
| 35 | Nagasaki | 63.82% | 46.47 |
| 36 | Oita | 63.63% | 46.21 |
| 37 | Kumamoto | 61.96% | 43.89 |
| 38 | Hiroshima | 61.49% | 43.23 |
| 39 | Kyoto | 61.38% | 43.08 |
| 40 | Aichi | 59.61% | 40.62 |
| 41 | Kanagawa | 59.26% | 40.13 |
| 42 | Miyagi | 58.19% | 38.65 |
| 43 | Hokkaido | 56.44% | 36.21 |
| 44 | Osaka | 54.84% | 33.99 |
| 45 | Fukuoka | 52.87% | 31.25 |
| 46 | Tokyo | 45.21% | 20.60 |
| 47 | Okinawa | 44.43% | 19.52 |
| Japan | 61.28% |
POSITIVE CORRELATION STATS (DIRECTLY PROPORTIONAL)
NEGATIVE CORRELATION STATS (INVERSE PROPORTIONAL)
CATEGORY : HOUSEHOLD & HOUSING
- Homeownership
- Rate of Nuclear Families
- Monthly Rent
- Homeownership
- Rate of Empty Rental Houses
- Households Living on Welfare
- Consumption Expenditure of Vegetables & Seaweeds Prepared in Soy Sauce
- Consumption Expenditure of Pickled Fish
- Consumption Expenditure of Fried food
- Rate of Single-parent Households
- Consumption Expenditure of Fried Bean Curd
- Rate of Double-Income Households
- Consumption Expenditure of Root Vegetables
- Consumption Expenditure of Leafy Vegetables
- Number of Children
- Consumption Expenditure of Bean curd
- Consumption Expenditure of Fruits
- Consumption Expenditure of Pickled Vegetables
- Consumption Expenditure of Mushrooms
- Consumption Expenditure of “Shiitake”, Japanese mushrooms, fresh
- Consumption Expenditure of Burdocks
- Consumption Expenditure of Taros
- Consumption Expenditure of String beans
- Consumption Expenditure of Cucumbers
- Consumption Expenditure of “Shimeji”, mushrooms
- Consumption Expenditure of “Enokitake”, mushrooms
- Consumption Expenditure of Sweet Potatoes
- Consumption Expenditure of Spinach
- Consumption Expenditure of Broccoli
- Consumption Expenditure of Eggplants
- Consumption Expenditure of Pumpkins
- Consumption Expenditure of Welsh Onions
- Consumption Expenditure of Other Raw Meat
- Consumption Expenditure of Lettuce
- Consumption Expenditure of Bean Sprouts
- Consumption Expenditure of Cucumbers
- Consumption Expenditure of Chinese cabbage
- Consumption Expenditure of Carrots
- Consumption Expenditure of White Potatoes
- Consumption Expenditure of Tomatoes
- Consumption Expenditure of Radishes
- Consumption Expenditure of Onions
- Consumption Expenditure of Cabbage
- Expenditure of Pocket Money (Household Heads)
- Consumption Expenditure of Shellfish
- Consumption Expenditure of Scallops
- Consumption Expenditure of Fresh Water Clams
- People Living Alone
SPONSORED LINKS
RECENT UPDATES
TOP STATS
- 1 Mean Elevation

- 2 Convenience Stores

- 3 Total Floor Space of Residential Buildings of one's own

- 4 Fitness Clubs

- 5 Mean Age at First Marriage (Male)
")
- 6 Automobiles Registered

- 7 Rate of Forest Land

- 8 Shinto Shrines

- 9 Foreign Residents in Japan

- 10 Prefectural Income

- 11 Homeownership

- 12 Population Density

- 13 Philippine Residents in Japan

- 14 Average Residential Land Price

- 15 Area
