
Consumption of Pork

Please put your mouse on the map above
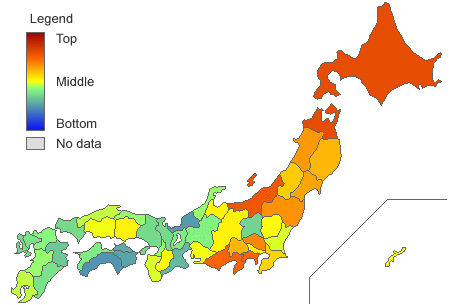
Amount of consumption of pork based on the Ministry of Internal Affairs and Communication's household expenditure survey. The household expenditure survey was conducted by selecting 9,000 households in Japan, from which one-member households were excluded, and the amount of consumption per household with two or more members was examined. With respect to the amount of expenditure by prefecture, the amount of expenditure was extracted for only prefectural capitals, based on which the trend of consumption for each prefecture is calculated. Likewise, in this website, the data for each prefecture is based on the data for each prefectural capital. The data is calculated based on the average for 2006, 2007 and 2008, with units in gram.
The national average amount of consumption of pork per household is 17,779 grams which, based on calculation, is 1,480 grams per month. This is the greatest among chicken, beef and pork. The amount of consumption of pork is greatest in Akita, with 22,117 grams. Aomori, Niigata and Hokkaido follow.
The distribution map shows that the amount of consumption is greater in eastern Japan and smaller in western Japan. The correlative ranking shows that it is negatively correlated with the amount of consumption of beef, indicating that pork is popular in eastern Japan and beef in western Japan. This can be seen in that in eastern Japan, pork is often used in "niku-jaga (Japanese home-cooked meal - meat and potatoes)" while beef is often used in western Japan.
CONSUMPTION OF PORK
| Rank | Prefectures | Consumption of Pork | Standard Score |
|---|---|---|---|
| Sort | Desc Asc | Desc Asc | Desc Asc |
| 1 | Hokkaido | 23,171g | 71.80 |
| 2 | Aomori | 23,060g | 71.25 |
| 3 | Niigata | 22,613g | 69.02 |
| 4 | Shizuoka | 22,271g | 67.31 |
| 5 | Kanagawa | 22,210g | 67.00 |
| 6 | Saitama | 21,495g | 63.43 |
| 7 | Fukushima | 21,238g | 62.15 |
| 8 | Akita | 21,139g | 61.65 |
| 9 | Miyagi | 20,947g | 60.70 |
| 10 | Iwate | 20,523g | 58.58 |
| 11 | Yamanashi | 20,424g | 58.08 |
| 12 | Yamagata | 20,020g | 56.07 |
| 13 | Chiba | 19,881g | 55.37 |
| 14 | Nagano | 19,339g | 52.67 |
| 15 | Tokyo | 19,335g | 52.65 |
| 16 | Okayama | 19,268g | 52.31 |
| 17 | Toyama | 19,260g | 52.27 |
| 18 | Tochigi | 19,160g | 51.77 |
| 19 | Nara | 19,108g | 51.51 |
| 20 | Okinawa | 19,105g | 51.50 |
| 21 | Aichi | 18,874g | 50.34 |
| 22 | Hiroshima | 18,864g | 50.29 |
| 23 | Wakayama | 18,771g | 49.83 |
| 24 | Ibaraki | 18,768g | 49.81 |
| 25 | Shimane | 18,459g | 48.27 |
| 26 | Kagoshima | 18,448g | 48.22 |
| 27 | Tottori | 18,192g | 46.94 |
| 28 | Osaka | 18,155g | 46.75 |
| 29 | Ishikawa | 18,053g | 46.24 |
| 30 | Kumamoto | 18,051g | 46.23 |
| 31 | Fukuoka | 17,819g | 45.07 |
| 32 | Gifu | 17,738g | 44.67 |
| 33 | Ehime | 17,483g | 43.40 |
| 34 | Shiga | 17,461g | 43.29 |
| 35 | Saga | 17,390g | 42.93 |
| 36 | Miyazaki | 17,264g | 42.30 |
| 37 | Hyogo | 17,154g | 41.75 |
| 38 | Yamaguchi | 17,081g | 41.39 |
| 38 | Nagasaki | 17,081g | 41.39 |
| 40 | Kyoto | 17,044g | 41.20 |
| 41 | Gunma | 16,849g | 40.23 |
| 42 | Oita | 16,619g | 39.08 |
| 43 | Mie | 16,314g | 37.56 |
| 44 | Kagawa | 15,953g | 35.75 |
| 45 | Tokushima | 15,703g | 34.51 |
| 46 | Fukui | 15,405g | 33.02 |
| 47 | Kochi | 15,294g | 32.46 |
| Japan | 19,564g |
POSITIVE CORRELATION STATS (DIRECTLY PROPORTIONAL)
NEGATIVE CORRELATION STATS (INVERSE PROPORTIONAL)
CATEGORY : LIFESTYLE
- Trucks Registered
- Automobiles Registered
- Mister Donut
- Starbucks
- Convenience Stores
- Consumption Expenditure of Yellowtail
- Passenger Cars Registered
- Motorcycles Registered
- Bus and Taxi Registered
- Komeda Coffee
- Number of Gateball Players (25 years of age or more)
- Number of Basketball Players (25 years of age or more)
- Number of Softball Players (25 years of age or more)
- Number of Volleyball Players (25 years of age or more)
- Number of Tennis Players (25 years of age or more)
- Number of Badminton Players (25 years of age or more)
- Number of Table Tennis Players (25 years of age or more)
- Number of Ski & Snowboard Players (25 years of age or more)
- Number of Joggers (25 years of age or more)
- Number of Anglers (25 years of age or more)
- Number of Swimmers (25 years of age or more)
- Number of Golfers (25 years of age or more)
- Number of Bowling Players (25 years of age or more)
- Number of Hikers (25 years of age or more)
- Number of Soccer Players (25 years of age or more)
- Number of Baseball Players (25 years of age or more)
- Game Parlors
- Number of Sports Players (25 years of age or more)
- Pachinko Parlors
- Mos Burger
- Kentucky Fried Chicken
- Number of Cyclists (25 years of age or more)
- Mean Age of Father at 1st Child Birth
- Mean Age of Mother at 1st Child Birth
- Consumption of Beer
- Average time spent on Volunteer and social activities
- Consumption Expenditure of Salmon
- Consumption Expenditure of Mackerel
- Consumption Expenditure of Saury
- Consumption Expenditure of Horse Mackerel
- Consumption Expenditure of Sardines
- Consumption Expenditure of Bonito
- Consumption Expenditure of Flounder
- Consumption Expenditure of Cuttlefish
- Consumption Expenditure of Octopus
- Consumption Expenditure of Shrimps & Lobsters
- Consumption Expenditure of Crabs
- Rate of Shotgun Wedding
- Mean Age at First Marriage (Male)
- Mean Age at First Marriage (Female)
- Fitness Clubs
- Book Stores
- Doutor Coffee
- Lotteria
- Consumption of Beef
- Consumption of Pork
- Consumption of Chicken
- Mobile Phone Subscriptions
- Broadband Contracts
- Video Arcades
SPONSORED LINKS
RECENT UPDATES
TOP STATS
- 1 Total Floor Space of Residential Buildings of one's own

- 2 Christians

- 3 Automobiles Registered

- 4 Convenience Stores

- 5 Population Density

- 6 Foreign Residents in Japan

- 7 Vietnamese Residents in Japan

- 8 Philippine Residents in Japan

- 9 Prefectural Income

- 10 Homeownership

- 11 Area

- 12 Minimum Wage

- 13 Mean Age of Mother at 1st Child Birth

- 14 Rate of Single-parent Households

- 15 Rate of Forest Land
