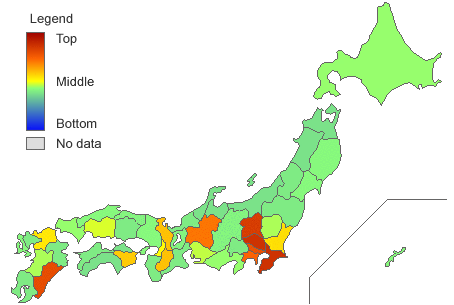
Spinach Production

Please put your mouse on the map above
Amount of production of spinach from the Ministry of Agriculture, Forestry and Fisheries' Statistical Information. 298,000 tons of spinach were produced in 2007 which is 23.34 tons per 10,000 population.
Miyazaki has the greatest amount of production per 10,000 population, with 125.11 tons. Gunma, Toushima, Chiba and Gifu follow. Chiba produced 40,400 tons of spinach in 2007, which is the greatest of all prefectures. Saitama, Gunma, Ibaraki and Miyazaki follow, indicating that the amount of production is great in Kanto.
The four prefectures, Fukushima, Tochigi, Gunma and Ibaraki, that have been holding off shipment due to the nuclear accident in Fukushima, produced a total of 51,000 tons together, accounting for 17% of the total amount of production.
SPINACH PRODUCTION
| Rank | Prefectures | Spinach Production | Standard Score | |
|---|---|---|---|---|
| Amount | per 100 | |||
| Sort | Desc Asc | Desc Asc | Desc Asc | Desc Asc |
| 1 | Chiba | 34,300トン | 36.53 | 76.17 |
| 2 | Saitama | 26,100トン | 36.36 | 76.00 |
| 3 | Gunma | 19,800トン | 34.69 | 74.37 |
| 4 | Miyazaki | 18,200トン | 31.89 | 71.63 |
| 5 | Tokyo | 3,960トン | 30.54 | 70.32 |
| 6 | Kanagawa | 7,920トン | 27.96 | 67.79 |
| 7 | Gifu | 12,100トン | 25.82 | 65.70 |
| 8 | Nara | 3,700トン | 17.83 | 57.89 |
| 9 | Kyoto | 5,170トン | 17.54 | 57.61 |
| 10 | Tokushima | 6,110トン | 15.95 | 56.06 |
| 11 | Ibaraki | 16,300トン | 14.39 | 54.53 |
| 12 | Fukuoka | 9,090トン | 13.35 | 53.52 |
| 13 | Osaka | 2,030トン | 11.36 | 51.58 |
| 14 | Hiroshima | 4,460トン | 9.59 | 49.85 |
| 15 | Aichi | 6,650トン | 8.60 | 48.87 |
| 16 | Tochigi | 6,030トン | 7.55 | 47.85 |
| 17 | Kumamoto | 6,130トン | 7.03 | 47.35 |
| 18 | Shizuoka | 4,410トン | 6.22 | 46.55 |
| 19 | Hokkaido | 6,750トン | 6.06 | 46.40 |
| 20 | Yamaguchi | 2,100トン | 5.97 | 46.30 |
| 21 | Nagasaki | 2,310トン | 5.64 | 45.98 |
| 22 | Shimane | 1,820トン | 5.64 | 45.98 |
| 23 | Okinawa | 1,210トン | 5.36 | 45.71 |
| 24 | Hyogo | 3,780トン | 5.15 | 45.50 |
| 25 | Miyagi | 3,460トン | 4.88 | 45.24 |
| 26 | Iwate | 4,180トン | 4.64 | 45.01 |
| 27 | Tottori | 1,440トン | 4.31 | 44.68 |
| 28 | Shiga | 1,140トン | 3.87 | 44.25 |
| 29 | Nagano | 3,690トン | 3.68 | 44.07 |
| 30 | Fukui | 830トン | 3.52 | 43.91 |
| 31 | Oita | 1,460トン | 3.32 | 43.71 |
| 32 | Yamagata | 2,110トン | 3.28 | 43.67 |
| 33 | Okayama | 1,950トン | 3.27 | 43.67 |
| 34 | Ehime | 1,720トン | 3.26 | 43.66 |
| 35 | Kagoshima | 2,390トン | 3.21 | 43.61 |
| 36 | Yamanashi | 1,060トン | 3.19 | 43.58 |
| 37 | Saga | 1,030トン | 3.04 | 43.45 |
| 38 | Fukushima | 3,210トン | 2.94 | 43.35 |
| 39 | Wakayama | 1,270トン | 2.90 | 43.30 |
| 40 | Mie | 1,160トン | 2.72 | 43.13 |
| 41 | Kagawa | 905トン | 2.56 | 42.97 |
| 42 | Kochi | 830トン | 2.43 | 42.85 |
| 43 | Aomori | 1,860トン | 2.31 | 42.73 |
| 44 | Toyama | 556トン | 2.29 | 42.71 |
| 45 | Ishikawa | 435トン | 1.94 | 42.37 |
| 46 | Akita | 1,380トン | 1.92 | 42.35 |
| 47 | Niigata | 1,780トン | 1.80 | 42.23 |
| Japan | 250,300トン | 9.61 | ||

