Rice Production

Please put your mouse on the map above
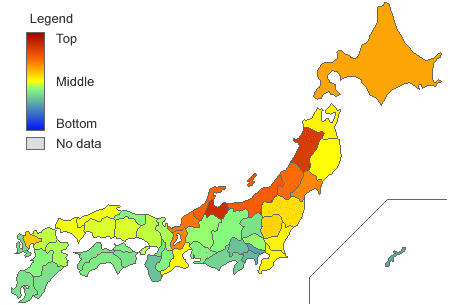
Rice production in 2008, announced by the Ministry of Agriculture, Forestry and Fisheries. Hokkaido is ranked first in the amount of crop production, slightly exceeding Niigata ranked second. Hokkaido, in which rice cultivation began to spread only in the 18th century due to the cool summer climate being unsuitable for rice cultivation, increased the amount of production together with the development of varieties of rice with high tolerance for cold and expansion of areas for cropping. Presently, Hokkaido is ranked number one in terms of both crop acreage and crop production. Because it was difficult to produce high grade rice, it has not been branded as Hokkaido rice, but recently, the taste and quality of rice produced in Hokkaido has been improving and the rate of grade 1 rice has been increasing.
On the other hand, crop production per 100 thousand population is highest in Akita, followed by other prefectures in northern Japan such as Yamagata, Niigata and Iwate. Compared to the Pacific side, there is less cold-weather damage on the Japan Sea side and with an abundance of melted snow water and vast farmland, the amount of crop production is high.
The greater amount of crop production on the Japan Sea side is a phenomenon seen not only in the Tohoku areas, but the amount of rice production is greater on the Japan Sea side compared to the Pacific sidein the Hokuriku and Sanin areas as well.
RICE PRODUCTION
| Rank | Prefectures | Rice Production | Standard Score | |
|---|---|---|---|---|
| Amount | per 100 | |||
| Sort | Desc Asc | Desc Asc | Desc Asc | Desc Asc |
| 1 | Toyama | 205,300トン | 975.62 | 77.31 |
| 2 | Akita | 498,800トン | 909.77 | 74.43 |
| 3 | Niigata | 611,700トン | 771.14 | 68.35 |
| 4 | Ishikawa | 131,300トン | 749.94 | 67.42 |
| 5 | Yamagata | 385,700トン | 718.36 | 66.03 |
| 6 | Fukui | 130,700トン | 706.14 | 65.50 |
| 7 | Shiga | 163,900トン | 659.29 | 63.45 |
| 8 | Miyagi | 354,700トン | 653.04 | 63.17 |
| 9 | Hokkaido | 581,800トン | 602.55 | 60.96 |
| 10 | Saga | 130,600トン | 497.64 | 56.36 |
| 11 | Tochigi | 294,200トン | 474.74 | 55.35 |
| 12 | Fukushima | 351,400トン | 452.23 | 54.37 |
| 13 | Chiba | 299,700トン | 408.26 | 52.44 |
| 14 | Ibaraki | 358,900トン | 400.58 | 52.10 |
| 15 | Aomori | 258,700トン | 399.56 | 52.06 |
| 16 | Mie | 131,500トン | 386.74 | 51.50 |
| 17 | Iwate | 265,400トン | 377.22 | 51.08 |
| 18 | Yamaguchi | 105,800トン | 373.77 | 50.93 |
| 19 | Shimane | 90,800トン | 366.11 | 50.59 |
| 20 | Okayama | 163,700トン | 337.74 | 49.35 |
| 21 | Hiroshima | 126,600トン | 333.61 | 49.17 |
| 22 | Hyogo | 183,400トン | 321.27 | 48.63 |
| 23 | Fukuoka | 181,700トン | 319.05 | 48.53 |
| 24 | Kyoto | 75,000トン | 302.91 | 47.82 |
| 25 | Oita | 106,300トン | 301.92 | 47.78 |
| 26 | Gifu | 106,900トン | 275.97 | 46.64 |
| 27 | Saitama | 156,100トン | 266.50 | 46.23 |
| 28 | Tottori | 65,500トン | 250.71 | 45.53 |
| 29 | Nagano | 203,200トン | 245.05 | 45.29 |
| 30 | Kumamoto | 175,500トン | 244.09 | 45.24 |
| 31 | Nara | 44,900トン | 231.22 | 44.68 |
| 32 | Aichi | 140,800トン | 220.91 | 44.23 |
| 33 | Kagawa | 62,000トン | 204.06 | 43.49 |
| 34 | Kochi | 54,600トン | 201.02 | 43.36 |
| 35 | Tokushima | 55,200トン | 182.68 | 42.55 |
| 36 | Miyazaki | 81,300トン | 180.66 | 42.46 |
| 37 | Osaka | 26,100トン | 176.40 | 42.28 |
| 38 | Gunma | 77,300トン | 175.66 | 42.24 |
| 39 | Ehime | 70,600トン | 171.76 | 42.07 |
| 40 | Kagoshima | 99,100トン | 171.21 | 42.05 |
| 41 | Nagasaki | 57,400トン | 166.67 | 41.85 |
| 42 | Shizuoka | 80,900トン | 141.13 | 40.73 |
| 43 | Yamanashi | 27,200トン | 98.07 | 38.84 |
| 44 | Wakayama | 33,300トン | 87.83 | 38.39 |
| 45 | Kanagawa | 15,700トン | 64.89 | 37.39 |
| 46 | Okinawa | 2,190トン | 11.00 | 35.02 |
| 47 | Tokyo | 583トン | 5.31 | 34.78 |
| Japan | 7,824,000トン | 373.16 | ||

