Manufacturing Industries

Please put your mouse on the map above
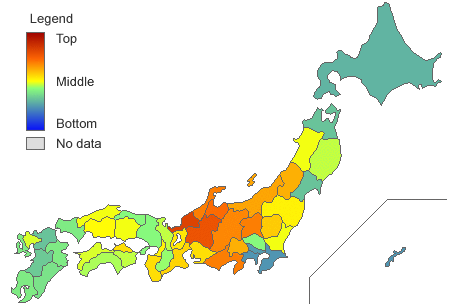
The number of manufacturing industries based on the Ministry of Economy, Trade and Industry's industrial statistics survey. Refer to volume of Industrial Production for the definition of manufacturing industry. With respect to the total number of manufacturing industries, Osaka is ranked number 1, followed by Aichi, Tokyo, Saitama and Shizuoka. Tokyo, ranked 10th in the volume of industrial production, is ranked 3rd here, and it can be seen that there are many small-sized businesses in Tokyo.
The number of manufacturing industries per 100 thousand population is greatest in Gifu, followed by Fukui, Shizuoka and Ishioka, with prefectures in central Japan ranked high. The distribution map also shows that the central part of Honshu is red, indicating the high concentration of manufacturing industries in this area.
The number of manufacturing industries per 100 thousand population is greatest in Gifu, followed by Fukui, Shizuoka and Ishioka, with prefectures in central Japan ranked high. The distribution map also shows that the central part of Honshu is red, indicating the high concentration of manufacturing industries in this area.
MANUFACTURING INDUSTRIES
| Rank | Prefectures | Manufacturing Industries | Standard Score | |
|---|---|---|---|---|
| Amount | per 100000 | |||
| Sort | Desc Asc | Desc Asc | Desc Asc | Desc Asc |
| 1 | Fukui | 2,570軒 | 571.11 | 73.05 |
| 2 | Gifu | 6,423軒 | 546.17 | 70.70 |
| 3 | Toyama | 3,001軒 | 496.85 | 66.05 |
| 4 | Shizuoka | 10,492軒 | 484.40 | 64.88 |
| 5 | Ishikawa | 3,270軒 | 483.73 | 64.81 |
| 6 | Gunma | 5,604軒 | 482.27 | 64.68 |
| 7 | Nagano | 5,562軒 | 470.56 | 63.57 |
| 8 | Niigata | 5,804軒 | 441.37 | 60.82 |
| 9 | Yamanashi | 2,106軒 | 431.56 | 59.89 |
| 10 | Yamagata | 2,662軒 | 422.54 | 59.04 |
| 11 | Tochigi | 4,713軒 | 395.39 | 56.48 |
| 12 | Mie | 4,070軒 | 383.24 | 55.34 |
| 13 | Kagawa | 2,097軒 | 379.20 | 54.96 |
| 14 | Aichi | 17,611軒 | 377.35 | 54.78 |
| 15 | Wakayama | 2,021軒 | 375.65 | 54.62 |
| 16 | Shiga | 3,114軒 | 361.67 | 53.31 |
| 17 | Fukushima | 3,971軒 | 355.82 | 52.76 |
| 18 | Osaka | 18,768軒 | 348.72 | 52.09 |
| 19 | Hiroshima | 5,661軒 | 339.80 | 51.24 |
| 20 | Akita | 1,869軒 | 336.76 | 50.96 |
| 21 | Ibaraki | 5,836軒 | 335.21 | 50.81 |
| 22 | Shimane | 1,255軒 | 333.78 | 50.68 |
| 23 | Okayama | 3,685軒 | 333.18 | 50.62 |
| 24 | Saga | 1,528軒 | 319.67 | 49.35 |
| 25 | Ehime | 2,469軒 | 318.58 | 49.24 |
| 26 | Kyoto | 4,906軒 | 314.49 | 48.86 |
| 27 | Iwate | 2,281軒 | 314.19 | 48.83 |
| 28 | Tokushima | 1,335軒 | 314.12 | 48.82 |
| 29 | Kochi | 1,173軒 | 296.21 | 47.14 |
| 30 | Nara | 2,257軒 | 285.70 | 46.14 |
| 31 | Saitama | 12,667軒 | 279.75 | 45.58 |
| 32 | Hyogo | 9,032軒 | 275.03 | 45.14 |
| 33 | Tottori | 891軒 | 275.00 | 45.14 |
| 34 | Kagoshima | 2,423軒 | 262.23 | 43.93 |
| 35 | Oita | 1,665軒 | 255.37 | 43.29 |
| 36 | Yamaguchi | 1,952軒 | 254.50 | 43.20 |
| 37 | Nagasaki | 1,969軒 | 254.07 | 43.16 |
| 38 | Miyazaki | 1,532軒 | 249.11 | 42.70 |
| 39 | Kumamoto | 2,220軒 | 219.15 | 39.87 |
| 40 | Aomori | 1,547軒 | 207.10 | 38.74 |
| 41 | Miyagi | 2,928軒 | 204.90 | 38.53 |
| 42 | Fukuoka | 6,172軒 | 200.91 | 38.15 |
| 43 | Hokkaido | 5,801軒 | 184.16 | 36.57 |
| 44 | Tokyo | 13,459軒 | 150.06 | 33.36 |
| 45 | Kanagawa | 8,439軒 | 146.05 | 32.98 |
| 46 | Chiba | 5,551軒 | 145.39 | 32.92 |
| 47 | Okinawa | 1,239軒 | 137.97 | 32.22 |
| Japan | 217,601軒 | 284.22 | ||

