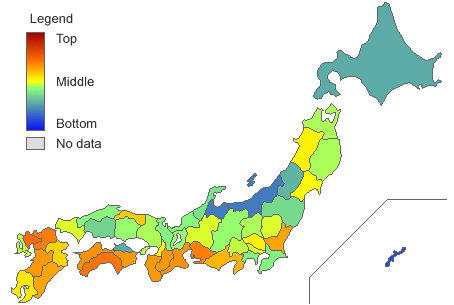
Rate of Artificial Forest Land

Please put your mouse on the map above
The rate of artificial forest land is calculated by dividing the area of artificial forest land by the area of forest land and is an index indicating how much of forest land is artificial.
The rate of artificial forest land is greatest in Saga, and prefectures on the Pacific Ocean coast are ranked high. This seems to be due to forestry in the Edo Period.
Before the Edo Period, many natural forests were cut down, but from around the 17th century, systematic afforestation began and characteristic forests, such as the cypress forests in Owase and the cedar forests in Yoshino, were made. Afforestation was actively conducted in areas on the Pacific Ocean coastline because not only were such areas suited for trees due to high rainfall in such areas, but they were also convenient for shipments to Edo and Osaka. The traces left from the past seem to be resulting in the high rate of artificial forest land on the Pacific coast.
RATE OF ARTIFICIAL FOREST LAND
| Rank | Prefectures | Rate of Artificial Forest Land | Standard Score |
|---|---|---|---|
| Sort | Desc Asc | Desc Asc | Desc Asc |
| 1 | Saga | 66.38% | 66.02 |
| 2 | Kochi | 65.28% | 65.18 |
| 3 | Aichi | 64.46% | 64.54 |
| 4 | Fukuoka | 63.97% | 64.17 |
| 5 | Mie | 61.81% | 62.50 |
| 6 | Ehime | 61.35% | 62.15 |
| 7 | Tokushima | 60.95% | 61.84 |
| 8 | Nara | 60.59% | 61.56 |
| 9 | Kumamoto | 60.49% | 61.49 |
| 10 | Wakayama | 60.41% | 61.42 |
| 11 | Ibaraki | 59.57% | 60.78 |
| 12 | Miyazaki | 59.45% | 60.68 |
| 13 | Shizuoka | 56.44% | 58.37 |
| 14 | Tottori | 54.13% | 56.59 |
| 15 | Oita | 52.33% | 55.20 |
| 16 | Kagoshima | 50.38% | 53.70 |
| 17 | Saitama | 49.36% | 52.91 |
| 18 | Akita | 49.03% | 52.66 |
| 19 | Osaka | 48.87% | 52.53 |
| 20 | Miyagi | 47.78% | 51.69 |
| 21 | Yamaguchi | 44.87% | 49.45 |
| 22 | Gifu | 44.67% | 49.30 |
| 23 | Tochigi | 44.64% | 49.27 |
| 24 | Tokyo | 44.32% | 49.03 |
| 25 | Yamanashi | 44.14% | 48.89 |
| 26 | Nagasaki | 43.22% | 48.18 |
| 27 | Aomori | 42.95% | 47.97 |
| 28 | Hyogo | 42.87% | 47.91 |
| 29 | Iwate | 42.24% | 47.42 |
| 30 | Gunma | 42.01% | 47.25 |
| 31 | Nagano | 41.65% | 46.97 |
| 32 | Shiga | 41.61% | 46.94 |
| 33 | Okayama | 41.49% | 46.85 |
| 34 | Fukui | 40.14% | 45.81 |
| 35 | Shimane | 39.16% | 45.05 |
| 36 | Chiba | 38.56% | 44.59 |
| 37 | Kyoto | 38.38% | 44.45 |
| 38 | Kanagawa | 38.26% | 44.36 |
| 39 | Ishikawa | 35.57% | 42.29 |
| 40 | Fukushima | 35.12% | 41.94 |
| 41 | Hiroshima | 32.82% | 40.17 |
| 42 | Yamagata | 27.78% | 36.28 |
| 43 | Hokkaido | 26.96% | 35.65 |
| 44 | Kagawa | 26.38% | 35.20 |
| 45 | Niigata | 19.04% | 29.55 |
| 46 | Toyama | 18.84% | 29.39 |
| 47 | Okinawa | 11.68% | 23.88 |
| Japan | 41.02% |

