
Railway Passenger Transport

Please put your mouse on the map above
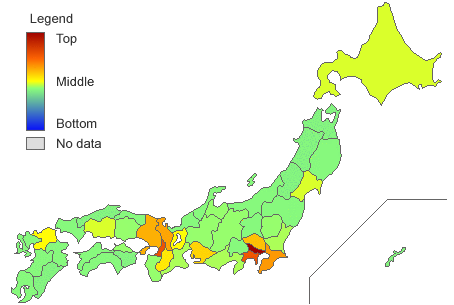
The amount of railway passenger transport by JR and private railway based on the Ministry of Land, Infrastructure, Transport and Tourism's survey on cargo and passenger flow. Passenger transport can be classified into
Number of departures: the number of passengers departing from a certain prefecture
Number of arrivals: the number of passengers arriving at a certain prefecture
Intraregional number: the number of passengers departing and arriving in within a certain prefecture
Here, the sum of the above three were compared. Estimated numbers are included in the original data as well as measured numbers.
Passenger transport per person is greatest in Tokyo, in which railway transport is used more than 800 times per person per year. Other prefectures in the metropolitan areas such as Kanagawa, Osaka, Chiba and Kyoto are ranked high. The data indicates that railway networks around metropolitan areas are extensive.
On the other hand, Miyazaki is ranked last, with railway transport used only 8 times per person per year. It is interesting to note that this number of use is lower than Okinawa, in which there are no railway systems except for the monorail that began operating in 2003. Miyazaki is the only prefecture in the mainland that has no railway besides JR and thus access to railways may be difficult.
In general, there is a clear distinction between metropolitan areas with railway transport use exceeding 200 times per year, and rural areas with railway tranport use of about 50 times per year. Students going to school by train seem to be inflating the number of railway transport use in rural areas, and because there are some adults that do not use the train even once a year, this result can be considered reasonable.
RAILWAY PASSENGER TRANSPORT
| Rank | Prefectures | Railway Passenger Transport | Standard Score | |
|---|---|---|---|---|
| Amount | per 1 | |||
| Sort | Desc Asc | Desc Asc | Desc Asc | Desc Asc |
| 1 | Tokyo | 9,638,013,100人 | 724.66 | 103.28 |
| 2 | Osaka | 2,849,373,700人 | 322.00 | 70.15 |
| 3 | Kanagawa | 2,808,900,800人 | 309.38 | 69.11 |
| 4 | Chiba | 1,328,478,000人 | 214.55 | 61.31 |
| 5 | Kyoto | 547,142,000人 | 209.07 | 60.86 |
| 6 | Hyogo | 1,071,628,900人 | 192.81 | 59.52 |
| 7 | Saitama | 1,237,474,600人 | 171.35 | 57.75 |
| 8 | Aichi | 1,105,916,500人 | 148.58 | 55.88 |
| 9 | Nara | 172,175,200人 | 124.49 | 53.90 |
| 10 | Fukuoka | 484,753,200人 | 95.24 | 51.49 |
| 11 | Shiga | 132,789,100人 | 93.78 | 51.37 |
| 12 | Miyagi | 163,225,900人 | 70.11 | 49.42 |
| 13 | Hiroshima | 195,504,700人 | 68.84 | 49.32 |
| 14 | Hokkaido | 357,920,300人 | 65.90 | 49.08 |
| 15 | Mie | 91,433,200人 | 49.88 | 47.76 |
| 16 | Shizuoka | 163,362,300人 | 43.88 | 47.26 |
| 17 | Ibaraki | 125,105,300人 | 42.68 | 47.17 |
| 18 | Okayama | 74,049,200人 | 38.37 | 46.81 |
| 19 | Wakayama | 37,248,100人 | 38.05 | 46.78 |
| 20 | Gifu | 72,474,100人 | 35.34 | 46.56 |
| 21 | Toyama | 35,832,900人 | 33.30 | 46.39 |
| 22 | Tochigi | 65,005,100人 | 32.73 | 46.35 |
| 23 | Nagano | 68,878,800人 | 32.46 | 46.32 |
| 24 | Kagawa | 29,400,700人 | 29.85 | 46.11 |
| 25 | Yamanashi | 24,071,100人 | 28.42 | 45.99 |
| 26 | Niigata | 65,904,600人 | 28.29 | 45.98 |
| 27 | Nagasaki | 36,329,200人 | 26.01 | 45.79 |
| 28 | Gunma | 50,631,700人 | 25.52 | 45.75 |
| 29 | Yamaguchi | 34,525,800人 | 24.31 | 45.65 |
| 30 | Saga | 19,562,100人 | 23.29 | 45.57 |
| 31 | Iwate | 27,012,000人 | 20.86 | 45.37 |
| 32 | Ishikawa | 24,115,200人 | 20.81 | 45.37 |
| 33 | Kagoshima | 34,366,100人 | 20.46 | 45.34 |
| 34 | Ehime | 28,736,500人 | 20.45 | 45.34 |
| 35 | Fukushima | 39,598,300人 | 20.35 | 45.33 |
| 36 | Fukui | 15,796,600人 | 19.87 | 45.29 |
| 37 | Kumamoto | 35,681,100人 | 19.81 | 45.28 |
| 38 | Kochi | 13,780,300人 | 18.50 | 45.18 |
| 39 | Tottori | 10,668,400人 | 18.46 | 45.17 |
| 40 | Oita | 21,518,400人 | 18.27 | 45.16 |
| 41 | Akita | 15,079,700人 | 14.36 | 44.83 |
| 42 | Yamagata | 15,941,700人 | 13.97 | 44.80 |
| 43 | Aomori | 17,491,100人 | 13.10 | 44.73 |
| 44 | Tokushima | 9,785,700人 | 12.71 | 44.70 |
| 45 | Shimane | 8,315,800人 | 11.85 | 44.63 |
| 46 | Okinawa | 14,903,000人 | 10.53 | 44.52 |
| 47 | Miyazaki | 8,838,300人 | 7.89 | 44.30 |
| Japan | 23,428,738,300人 | 184.05 | ||
POSITIVE CORRELATION STATS (DIRECTLY PROPORTIONAL)
NEGATIVE CORRELATION STATS (INVERSE PROPORTIONAL)
CATEGORY : BACKGROUND
- Rate of Empty Houses
- Total Floor Space of Residential Buildings of rental housing
- Total Floor Space of Residential Buildings of one's own
- Total Floor Space of Residential Buildings of one's own
- Mean Elevation
- Vacation Homes
- Design Registrations
- Trademark Registrations
- Utility Model Registrations
- Patent Registrations
- Patent Attorneys
- Poplar
- Seicomart
- Daily Yamazaki
- Ministop
- Lowson
- Family Mart
- Seven Eleven
- Consumption Expenditure of Women's clothing
- Consumption Expenditure of Sugar
- Consumption Expenditure of Medicines
- Patient with Cavity
- Patient with Fracture
- Patient with Fracture
- Patients with Major depressive disorder (aged 65 or above)
- Patients with Major depressive disorder
- Patients with Asthma
- Highest temperature
- Hospital
- Consumption Expenditure of Medical Services
- BMI Female
- BMI Male
- Patients with Cancer (aged 65 or above)
- Patients with Cancer
- Patients with Diabetes (aged 65 or above)
- Patients with Diabetes
- Patients with Dyslipidemia
- Patients with Cerebral Infarction (aged 65 or above)
- Patients with Hypertension (aged 65 or above)
- Consumption Expenditure of Bonito Fillets & Fish Flakes, Dried
- Consumption Expenditure of Dried Tangle
- Consumption Expenditure of Dried Laver
- Consumption Expenditure of ”Wakame”, seaweed
- Consumption Expenditure of Ready-to-eat Food
- Consumption Expenditure of ”Kabayaki”,Broiled Eels
- Consumption Expenditure of Salad
- Consumption Expenditure of Cutlets
- Consumption Expenditure of Hamburg Steak
- Consumption Expenditure of “Yakitori”,Grilled Chickens
- Consumption Expenditure of Jiao-zi
- Consumption Expenditure of Packed Lunch
- Consumption Expenditure of Onigiri
- Consumption Expenditure of Frozen Food
- Consumption Expenditure of Croquettes
- Consumption Expenditure of Shao-mais
- Licensed Architect (1st grade)
- Real Estate Notary
- Consumption Expenditure of Butter
- Consumption Expenditure of Cheese
- Online Video Penetration
- Facebook User
- Online Game Penetration
- Cellphone Penetration
- Online Shopping Penetration
- Smartphone Penetration
- SNS Penetration
- Internet Penetration
- Working Hours
- Sleeping Hours
- Rest and Relaxation Ttime
- Women's Housekeeping Time
- Mass Media Viewing TIme
- Meal TIme
- Consumption Expenditure of Citrus Fruits
- Consumption Expenditure of Oranges
- Consumption Expenditure of Watermelons
- Consumption Expenditure of Apples
- Consumption Expenditure of Mandarin Oranges
- Consumption Expenditure of Bananas
- Consumption Expenditure of Strawberries
- Consumption Expenditure of Coffee
- Consumption Expenditure of Mineral Water
- Consumption Expenditure of Fermented Lactic Beverages
- Consumption Expenditure of Milk
- Consumption Expenditure of Black Tea
- Consumption Expenditure of Carbonated Beverages
- Consumption Expenditure of Green Tea
- Engel's coefficient
- Consumption Expenditure of Cakes & Candies
- Consumption Expenditure of Fried & Salted Snack Crackers
- Consumption Expenditure of Biscuits
- Consumption Expenditure of 'Kasutera', Sponge Cakes
- Consumption Expenditure of 'Manju', Bean-jam Cakes
- Consumption Expenditure of Puddings
- Consumption Expenditure of Jelly
- Consumption Expenditure of 'Senbei', Japanese Crackers
- Consumption Expenditure of Cakes
- Consumption Expenditure of 'Yokan', Sweet Bean Jelly
- Consumption Expenditure of Chocolate
- Consumption Expenditure of Candies
- Consumption Expenditure of Instant Dried Soup
- Consumption Expenditure of 'Tsuyu' & 'Tare', Liquid Seasonings
- Consumption Expenditure of ’Furikake’, Granular Flavour Seasonings
- Consumption Expenditure of Flavour Seasonings
- Consumption Expenditure of Tomato Ketchup
- Consumption Expenditure of Margarine
- Consumption Expenditure of Salt
- Consumption Expenditure of Edible Oil
- Consumption Expenditure of Instant Curry Mix
- Consumption Expenditure of Jam
- Consumption Expenditure of Dressing
- Consumption Expenditure of Mayonnaise & Mayonnaise Flavor Seasoning
- Consumption Expenditure of Worcester Sauce
- Consumption Expenditure of Vinegar
- Consumption Expenditure of Soy Sauce
- Consumption Expenditure of Soybean Paste
- Consumption Amount of Umbrella
- Attractiveness
- Labor and Social Security Attorney
- Internet cafe
- Camp Site
- Ski Resort
- Bowling Alley
- Croquet and Gateball Field
- Dance Studio, Dance Hall
- Firing Range
- Skating Rink
- Riding Ground
- Golf Course
- Japanese Archery Range
- Sumo Ring
- Tennis Court
- Kendo Hall
- Judo Hall
- Swimming Pool
- Athletic Field
- Baseball ground
- Curator
- Gym
- Natural Gas Consumption
- Liquefied Petroleum Gas Consumption
- Kerosene Consumption
- Electric Energy Consumption
- Monthly Cost of Water
- Paved Rate
- Total Road Length
- Employed Persons in Tertiary Industry
- Employed Persons in Secondary Industry
- Employed Persons in Primary Industry
- Gyudon (Beef bowl) Stores
- Nakau
- Matsuya
- Yoshinoya
- Sukiya
- Participants in Child-Rearing Assistance Activities (25 years of age or more)
- Participants in Community Safety Activities (25 years of age or more)
- Participants in Nature Conservation Activities (25 years of age or more)
- Participants in Community Development Activities (25 years of age or more)
- Theatergoers (25 years of age or more)
- Participants in Classical Music Concert (25 years of age or more)
- Participants in Concert (25 years of age or more)
- Participants in Chorus and Vocal music (25 years of age or more)
- Participants in Playing Japanese music (25 years of age or more)
- Participants in Playing Instrumentst (25 years of age or more)
- Participants in Japanese Dance (25 years of age or more)
- Participants in Dance (25 years of age or more)
- Theaters and Concert halls
- Participants in Dressmaking (25 years of age or more)
- Participants in Drawing Pictures and Sculpturing (25 years of age or more)
- Participants in Crafts and Ceramics (25 years of age or more)
- Amateur Photographers (25 years of age or more)
- Waka, Haiku, Poetry and Novel Composers (25 years of age or more)
- Amusement park, Zoo, Botanical garden, Aquarium Visitors (25 years of age or more)
- Participants in Cooking and Sweets Cooking (25 years of age or more)
- Domestic Tourists (Overnight stay)(25 years of age or more)
- Number of people who went back to their hometown (25 years of age or more)
- Moviegoers (25 years of age or more)
- Video Game Players (25 years of age or more)
- Pachinko Players (25 years of age or more)
- Participants in Karaoke (25 years of age or more)
- Participants in DIY (25 years of age or more)
- Participants in Gardening (25 years of age or more)
- Participants in Knitting and Handicraft (25 years of age or more)
- Participants in Arts and Culture Studies (25 years of age or more)
- Participants in Homemaking Training (25 years of age or more)
- English language learners (25 years of age or more)
- Participants in Japanese calligraphy (25 years of age or more)
- Participants in Japanese tea ceremony (25 years of age or more)
- Participants in Japanese flower arrangement (25 years of age or more)
- Valid Passports
- Saveon
- Christians
- Buddhists
- Shintoists
- Churches
- Temples
- Shinto Shrines
- Local Government Employees
- Population Density
- Concentration of Population
- Consumption Expenditure of Handbags
- Consumption Expenditure of Accessories
- Consumption Expenditure of Children's Underwear
- Consumption Expenditure of Women's Underwear
- Consumption Expenditure of Men's Underwear
- Consumption Expenditure of Children's dresses
- Consumption Expenditure of Men's clothing
- Automobile Accidents
- Participants in Volunteer Work (25 years of age or more)
- Book Readers (25 years of age or more)
- Participants in Shogi (25 years of age or more)
- Participants in Go (25 years of age or more)
- Spectator Sport Watchers (25 years of age or more)
- Number of campers (25 years of age or more)
- Outbound Tourists (25 years of age or more)
- Domestic Tourists (Overnight stay)(25 years of age or more)
- Salary of Prefectural Governors
- Traffic-Related Death Rate - All
- Traffic-Related Death Rate - Pedestrian
- Traffic-Related Death Rate - Bicyclist
- Traffic-Related Death Rate - Motorcyclist
- Traffic-Related Death Rate - Driver
- Drowning Death Rate (Except for Bath)
- Drowning Death Rate (Bath)
- Fire Death Rate
- Consumption Expenditure of Clothing & Footwear
- Consumption Expenditure of School Uniforms
- Washing Charges
- Senior Citizens
- Husband and Wife
- Consumption of Alcohol
- Consumption of Wine
- Consumption of Whisky
- Consumption of Shochu
- Consumption of Sake
- Ministry of Health, Labour and Welfare
- Consumption Expenditure of Short-Necked Clams
- Consumption Expenditure of Oysters
- Attorney
- Certified Public Accountant
- Consumption Expenditure of Flower
- Consumption Expenditure of Seafood
- Nurse
- Rate of Female Physicians
- Dental Clinics
- Beds for Mental Patients
- Beds for Long-Term Care
- General Beds
- Psychiatric Hospitals
- Clinic
- School Personnel
- Population Ratio
- Pharmacies
- Job Offer Retractions
- Population
- Delivery Cost
- Rate of Intraregional Railway Passenger Transport
- Railway Passenger Transport
- Murder Victims
- Amount of Greenhouse Gas Emission
- Suicide Victims: Female
- Suicide Victims: Male
SPONSORED LINKS
RECENT UPDATES
TOP STATS
- 1 Mean Elevation

- 2 Fitness Clubs

- 3 Convenience Stores

- 4 Total Floor Space of Residential Buildings of one's own

- 5 Mean Age at First Marriage (Male)
")
- 6 Christians

- 7 Automobiles Registered

- 8 Prefectural Income

- 9 Homeownership

- 10 Foreign Residents in Japan

- 11 Thai Residents in Japan

- 12 Philippine Residents in Japan

- 13 Population Density

- 14 Rate of Forest Land

- 15 Starbucks
